The results for Interlock are presented on this table, broken down according to area. (Those areas where no interlocked performances were coded are not included in the list.) I suggest right clicking on the above link and choosing "Open in New Window," so you can examine the list and continue reading here. The leftmost column lists area names, the middle column total sample size for each area, and the rightmost column the percentage of interlocked performances from each sample. "African Gatherers," a little more than halfway down the list, has by far the highest percentage: 57.78%. Interestingly, the next highest area is among native Americans in California, where 30.56% percent of the sample is coded as interlock, thanks largely to a very unusual tradition of interlocked vocalizing among the Hupa. Such a practice is not at all typical for native Americans north of Mexico, but not uncommon among the Inuit, far to the north, as well as the Ainu of Japan. (See my comments on "shouted hocket," below.) Next highest is 28.8% for the Horn of Africa, largely due to the many unusual tribal groups in southwest Ethiopia who sing in a type of interlocked polyphony very similar to that of Pygmies and Bushmen (though mostly without yodel), as discussed below. No other area is represented by more than 17%. I've already written a fair amount regarding interlock as part of an "African signature" found among various indigenous groups worldwide, so it isn't surprising to see it cropping up in areas like Melanesia, Indonesia, South America, etc., as well as various parts of Africa, as already discussed. Nevertheless, what remains especially important with respect to the interpretation offered here of the Kalahari debate, is the extraordinarily high percentage of interlock among African Gatherers.
Let's take a look at a very similar table, depicting the world distribution of yodel. Again, the African Gatherer sample stands out, at 52.22%. No other area is represented by much more than 13%.
Now that we have some idea where interlock and yodel would seem to fit in the world picture, let's return our attention to Africa, taking another look at a Cantometric-based map I presented in an earlier post, indicating the distribution of interlock and yodel on that continent.
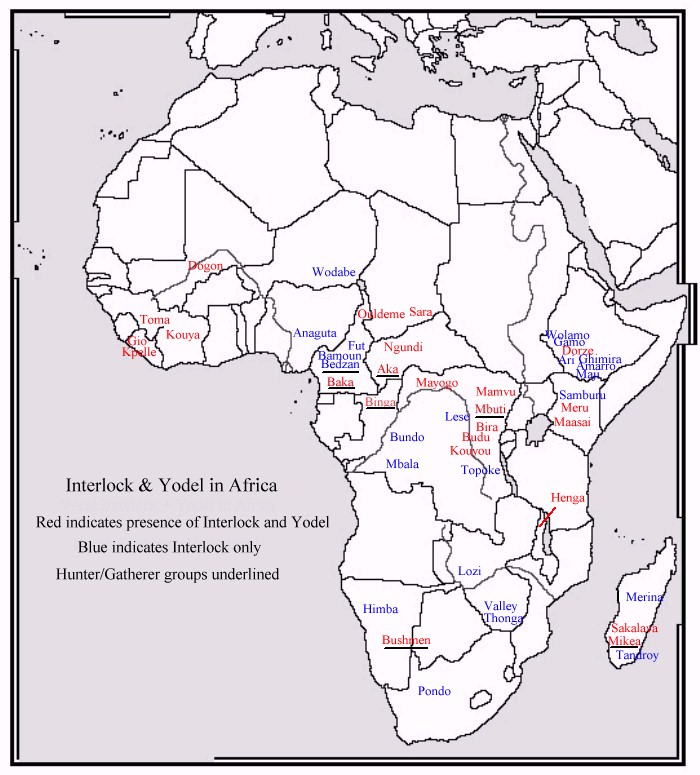
While the map shows us where interlock, both by itself and combined with yodel, can be found, it's somewhat misleading, because, even if only one instance of interlock (or interlock + yodel) was found in a particular sample, that group was included.
Here's a table that provides much more detailed information on the distribution of both interlock and yodel in Africa. I'll let you ponder this on your own for now, but promise to discuss it in some detail in my next post.


No comments:
Post a Comment